
Your Backtest Isn't Lying. It Just Never Tells the Truth.
A backtest is a story you tell yourself. Here is how I interrogate mine — and the one question I still can't answer.

Every few days the same story shows up wearing a different face.
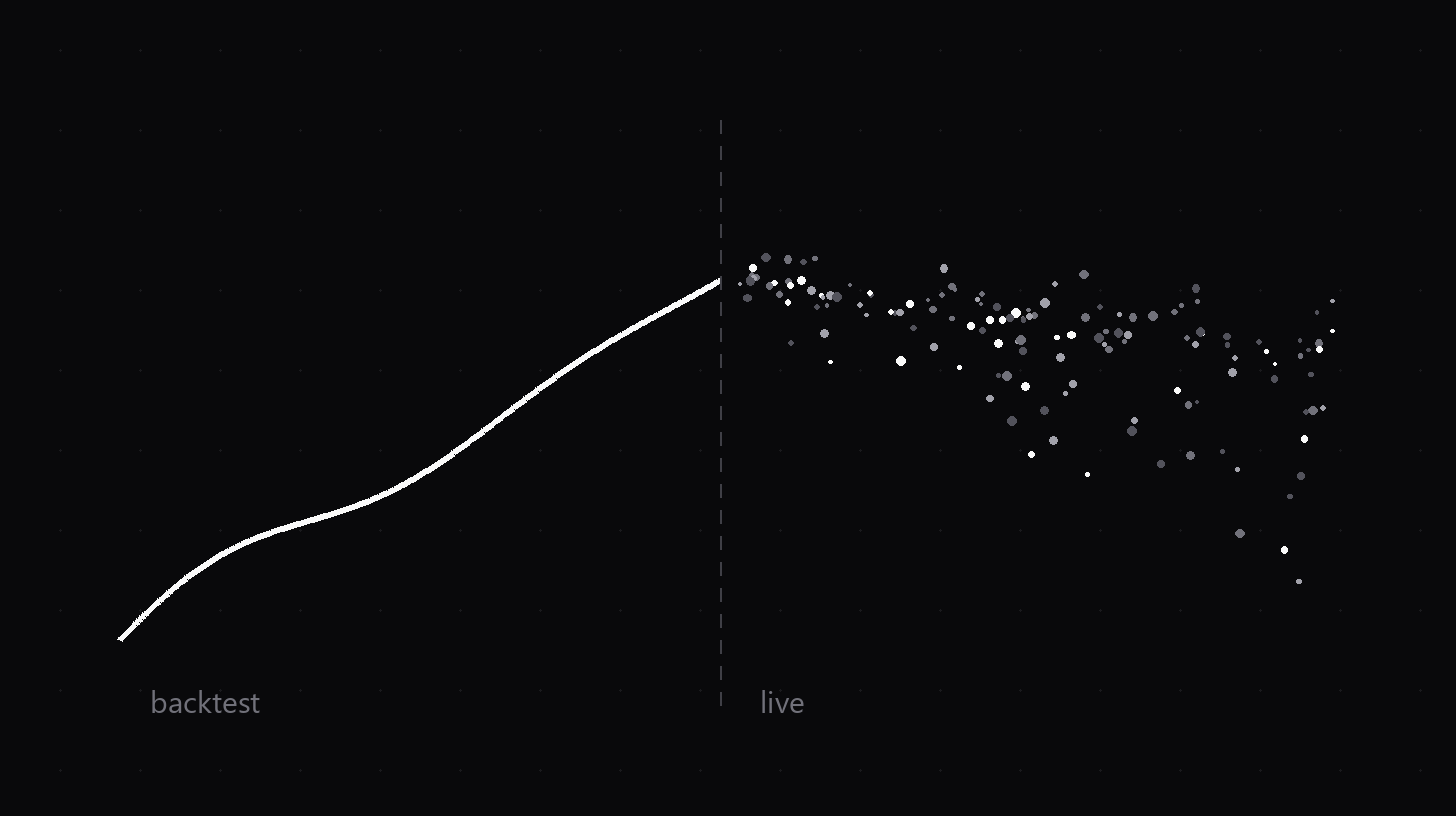
The equity curve looks like it came out of a textbook. The strategy goes live. Three months later the author is back, and this time the word “post-mortem” is in the title.
I’ve read a lot of these posts. Honestly, I read every one of them carefully — not for entertainment, but as a mirror. I was educated by the market the exact same way.
A backtest is not evidence. It’s a story.
Let me put the ugly sentence first:
A backtest is never evidence. It’s a story you tell yourself.
The data is from the past. The parameters are ones you picked. The sample period is one you chose. The costs are ones you assumed. At every single step, an invisible hand is helping the strategy look good — and that hand is yours. You want it to work too badly.
In science there’s a name for this: being the athlete and the referee in the same game.
So a beautiful equity curve proves nothing by itself. It proves exactly one thing: that inside a slice of the past you carefully selected, under a set of parameters you only settled on after the fact, there once theoretically existed a way to make money.
Count the qualifiers in that sentence.
The usual ways it deceives you
I’m not going to hand out formulas, and I can’t give you a “checklist to avoid the traps” — there is no checklist. There is only interrogation. Here are the directions I point the lamp when I interrogate my own work.
First, ask where the parameters came from. If the answer is “I tuned them until it worked,” then that curve is probably not your strategy’s report card. It’s your search algorithm’s report card. You picked the best-looking result out of thousands of combinations — which is roughly the same as announcing your lottery numbers after the draw.
Second, ask whether it has ever died. A curve with no ugly drawdown is far more suspicious than a curve with one. The market has killed everyone at some point. A strategy that has “never been killed” most likely hasn’t met its own way of dying yet — that is very different from not having one.
Third, ask whether the costs are a fairy tale or reality. In a backtest, fills are instant, complete, and at the price you wanted. In live trading, fills wait in line, run away from you, and get worse precisely when you’re desperate. For a high-turnover strategy, the gap between backtest and live isn’t a rounding error. It’s a canyon.
Fourth, ask whether the sample period was a tailwind. A thing validated inside one long trending regime often validates the regime, not your logic. Show it a different market state and watch how many “holy grails” fall apart on the spot.
None of these four directions require advanced math. They require something else: the willingness to interrogate your own favorite creation to death.
Most people aren’t willing. I’m often not willing either. That’s human nature, not a technical problem — which is exactly why it’s hard.
What I actually use backtests for
By now you might think I’m against backtesting. The opposite. I do it every day.
The difference is the job description.
I never use a backtest to answer “how much can this make.” I only use it to answer “when, and in what way, will this thing die.”
When I get a new curve, the first thing I look at is not the return. It’s the ugliest stretch: how deep the worst hole goes, how long it took to climb out, and whether I — as a human being, not a spreadsheet — could sit through that stretch without breaking. Numbers can lie. Whether you can sleep at night cannot. Your account will be honest on your behalf.
For me a backtest is a minesweeper, not a salesman. It can tell me roughly where the mines are. The fortune it promises, I don’t eat a single bite of.
One honest “I don’t know”
Here I have to stop and give you a real one.
Even after running every interrogation above, there is a question I still cannot answer today: when a live strategy starts decaying, I cannot tell in real time whether it’s normal variance or the strategy is already dead. All I can do is follow rules I wrote in advance and grind through it; only afterwards do I find out which one it was. Every single time feels like driving in fog. I haven’t figured this out, and maybe I never will — the market doesn’t send out obituaries in advance.
If someone tells you he can distinguish “drawdown” from “death” in real time, listen politely.
Three questions
Next time someone shows you an equity curve rising at 45 degrees — a course seller, a group runner, or just someone who wants your approval — don’t rush to be impressed. Ask three questions:
Where did the parameters come from?
Has it ever died?
What did you assume for costs?
After those three questions, most curves go quiet on their own.
The few that don’t — those are the ones worth your second hour.
Disclaimer: This is a personal record of my own trading and thinking. Nothing here is investment advice.